----------------------------------------------------------------------------------------------------------------------
05/02/2011
Etude NEMESIS: Out-of-hospital airway management in the United States
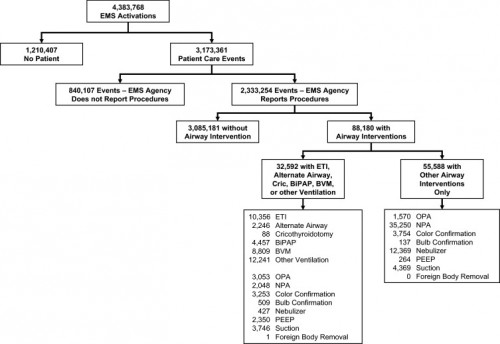
Un travail prospectif recensant toutes les manoeuvres de contrôle des voies aériennes aux USA vient d'être publié ( Out-of-hospital airway management in the United States - Wang HE et all. -doi:10.1016/j.resuscitation.2010.12.014). Ce document est intéressant car il confirme que l'intubation est le mode premier de contrôle de la ventilation aux USA suivi par la ventilation manuelle au ballon. Le recours à des disposiifs laryngés ne vient qu'au 4ème rang après la mise en oeuvre de technqiues de ventilation non invasive. L'apprentissage de l'intubation reste donc un objectif essentiel. Les tableaux suivant en présentent les principaux résultats.
Table 1. Prevalence of airway management interventions. Table includes only EMS agencies reporting at least one procedure in the NEMSIS 2008 data set. Percentages reflect portion of 2,333,254 total patient care events. Prevalence estimates not calculated for King LT and foreign body removal due to the small numbers of events. BiPAP = bilevel positive airway pressure. CPAP = continuous positive airway pressure. PEEP = positive end expiratory pressure.
| Intervention | N | (N per 100,000 care events; 95%CI) |
|---|---|---|
| Bag-valve-mask ventilation | 8809 | (378; 370–386) |
| Other ventilation (bag-valve, mechanical, unspecified) | 12,241 | (525; 516–534) |
| Endotracheal intubation | 10,356 | (444; 436–453) |
| Orotracheal intubation | 9130 | (392; 384–400) |
| Nasotracheal intuabtion | 1064 | (46; 43–48) |
| Rapid sequence intubation | 371 | (16; 14–18) |
| Alternate airway | 2246 | (96; 92–100) |
| Combitube | 1521 | (65; 62–69) |
| Esophageal-Obturator Airway (EOA) | 175 | (8; 6–9) |
| Laryngeal Mask Airway | 571 | (24; 23–27) |
| King LT | 4 | (Not calculated) |
| Cricothyroidotomy | 88 | (4; 3–5) |
| BiPAP/CPAP | 4456 | (191; 186–197) |
| Oropharyngeal airway | 4623 | (198; 193–204) |
| Nasopharyngeal airway | 37,298 | (160; 158–161) |
| Colorimetric tube confirmation | 7007 | (300; 294–308) |
| Bulb tube confirmation | 646 | (28; 26–30) |
| Nebulizer | 12,796 | (549; 539–558) |
| PEEP | 2614 | (112; 108–117) |
| Suction | 8115 | (348; 341–356) |
| Foreign body removal | 1 | (Not calculated) |
----------------------------------------------------------------------------------------------------------------------
Table 3. Airway intervention success. Includes only orotracheal, nasotracheal and rapid sequence intubation and alternate airway insertions where procedural success was reported. ETI success was reported for only 8418 of 10,356 ETI.
ETI = endotracheal intubation. US = United States.
a Subgroups do not add up to total because of unknown cardiac arrest status for 5244 cases. Univariable odds ratios presented for selected comparisons only.
----------------------------------------------------------------------------------------------------------------------
Abstract
-----Among 4,383,768 EMS activations, there were 10,356 ETI, 2246 alternate airways, and 88 cricothyroidotomies. ETI success rates were: overall 6482/8418 (77.0%; 95% CI: 76.1–77.9%), cardiac arrest 3494/4482 (78.0%), non-arrest medical 616/846 (72.8%), non-arrest injury 417/505 (82.6%), children <10 years 295/397 (74.3%), children 10–19 years 228/289 (78.9%), adult 5829/7552 (77.2%), and rapid-sequence intubation 289/355 (81.4%). ETI success was success was lowest in the South US census region. Alternate airway success was 1564/1794 (87.2%). Major complications included: bleeding 84 (7.0 per 1000 interventions), vomiting 80 (6.7 per 1000) and esophageal intubation 12 (1.0 per 1000).
Conclusions
In this study characterizing out-of-hospital airway management across the United States, we observed low out-of-hospital ETI success rates. These data may guide national efforts to improve the quality of out-of-hospital airway management.
| Tags : airway, intubation


Les commentaires sont fermés.